

Michael Cohen prepares for a test run of his submersible ROV in the tidal portion of the Peconic River.
In 2012 Michael Cohen, graduate of URI, spent a summer on the tour boat collecting data with a YSI meter and recording first-hand observations of other abiotic factors in the Peconic Estuary. We have previously posted his graphs of our readings from the 2011 through 2013 tour boat seasons. In subsequent graduate work, Michael has most recently created a project proposal based on his experiences and developed around his engineering of a submersible ROV. The ROV will allow the user to observe the entire water column at each station and further correlate YSI data with the occurrence and abundance of marine life observed.

Adjusting flotation to accommodate differences in density found in the salt wedge.
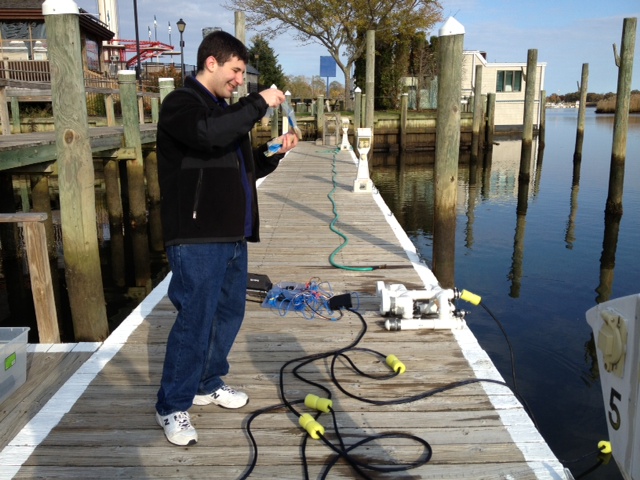
Michael prepares sand bags to modify his field trial.
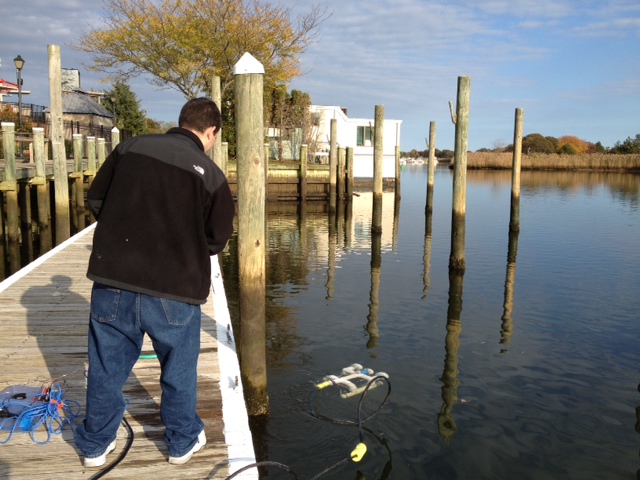
The ROV descends with a video feed and live capture of plankton.
Michael Cohen, Project Leader
Marine Ecosystems Project Proposal
Effects of Water Quality on the Diversity of Plankton and Fish Species along the Peconic Estuary
Introduction
Estuaries are environments where fresh water from rivers mixes with ocean water. They are characterized by water density and flow. The interactions of different water densities, rise and fall of the tide, and variations in river flow show complex patterns of water circulation in an estuary. This allows estuaries to be categorized by their circulation patterns. These circulation patterns lead towards an organized variability in water quality throughout an estuary.
Species that live in estuaries are adapted to tolerate salinity fluctuations. Salinity is known to be a critical factor in limiting the range of travel for marine species, however, there are many that are capable of rapid regulation and adjust to the changing osmotic stress of varying salinity. There are also species that are adapted to this environment by occupying the bottom waters, where salinity is greatest. They are able to penetrate an estuary farther upstream than species that occupy the surface, such as planktonic organisms.
Numerous studies have been conducted that show the effects of water quality on estuary species. Studies performed on the San Francisco Bay estuary hypothesized that seasonal and interannual fluctuations in estuarine phytoplankton biomass and primary production could be regulated jointly by direct physical efforts and trophic interactions (Alpine and Cloern, 1992). An observation on the South San Francisco Bay showed that estuarine phytoplankton biomass fluctuates because of variability fluctuations in tidal energy (Cloern, 1991). Another study suggested tidal flux at a particular location might have an effect on recruitment on estuary species that spawn offshore (Boehlert and Mundy, 1988). In the northern part of the estuary, the phytoplankton are in low biomass and dominated by microflagellates or freshwater diatoms in winter, and high biomass dominated by neritic diatoms in summer (Cloern et al., 1983). For the Chesapeake Bay, in the spring there is a high biomass of phytoplankton and zooplankton during times of high input of freshwater (Roman et al., 2005).
This proposal will study how water quality affects the diversity of plankton and fish species along the Peconic Estuary. Salinity is major contributor towards where a species can live and prosper, however this project will take into account the levels of dissolved oxygen and temperature measurements of the area to determine if other environmental factors influence species distribution. With the Peconic Estuary having the characteristics of a salt wedge estuary, it could have a significant affect on the richness and evenness of species at different locations and the salinity readings should be able to give an indication of its characteristics. The project also has the opportunity to educate the general public on how scientific research studies are conducted, the different equipments that are used, and give them some understanding about the constant changes that are occurring in the environment and how it can be monitored.
Organizations
The Long Island Aquarium is located along the scenic Peconic River in Riverhead. The Aquarium is home to The Riverhead Foundation for Marine Research and Preservation, New York’s only authorized marine mammal and sea turtle rescue and rehabilitation center. Themed around the “Lost City of Atlantis,” it blends science and nature with myth to create an informative and entertaining environment for visitors. It offers a variety of experiences, from fascinating marine life exhibits to Aquatic Adventures and educational programs. Their goal is to capture the visitors’ imaginations and emphasize the importance of marine life and environmental preservation. They aim to provide an interactive and exciting educational experience.
With the corporation provided by the staff of the Long Island Aquarium’s Explorer Tour Boat and equipment, the desirable test sites will be accessible. The measurements of water quality can be collected along with noting the richness of fish and plankton species at both sites. In return for the aid and access, a presentation will be made to educate visitors on the purpose of the project and the importance of it. In addition to that, the presentation will also describe how the equipment is used for this project and in the scientific community. After the diversity indices tables and water quality graphs are made, they can be posted on Blue Ocean Institute’s Next Wave in the Peconic Estuary blog to allow the educational community and the general public to gain an understanding of ecosystem diversity. The goals of the Blue Ocean Institute are to understand how the ocean is changing and what changes mean for wildlife and people. It also provides scientific information so interested people with a limited scientific background can understand it.
Materials and Methods
To determine how the salt wedge characteristics affect the diversity of species, certain materials and methods will be needed to gather the appropriate data. The materials that will be used in the project include a ROV, plankton net, magnifying glass, YSI meter, seine net, and the computer program Microsoft Excel. The aquarium will provide the YSI meter and seine net. The seine net is already being used as a tool to gather fish to show visitors what type of species can be found in the area. Educators and interns involved in the “data collection assistant” internship offered by the aquarium operate the YSI meter. The project leader will provide the ROV, plankton net, and magnifying glass. The ROV and plankton net are homemade and designed to be used together.
The ROV’s frame is made out of 2 inch PVC piping and fittings. It is structured to house the electronics (control relays, wiring, camera system, and lights). The typical homemade ROV has frame structures which are box-shaped and separate housings for the electronics which are placed on the frame. The frame is glued together with PVC cement and the edges sealed with marine sealant to prevent leaks. At the back end of the ROV, the power wires, control wires, and Ethernet cable are threaded through a PVC rubber pipe cap and then sealed with hot glue, marine epoxy, and marine sealant. The three windows for the camera and two lights were created with a PVC trap adapter with Plexiglas and sealed using the same three sealants as the pipe cap, with the addition of electrical tape. The electrical tape is used to seal small leaks but allow access to the lights and camera.
The frame structure is built to have an upper and lower compartment. The upper compartment houses the electronics while the lower compartment acts as ballast to add negative buoyancy to the ROV. Due to the amount of air the 2-inch pipes can hold, the ballast compartments are filled with wet play sand (the type used in children’s sandboxes). The reason for using wet sand is because, even though the sand alone fills up the ballast compartment to its fullest, the interstitial space between the sand contains air. Carefully filling the ballasts with water to the point where all the sand is damp allows for the appropriate negative buoyancy to be added, achieving a slightly positively buoyant ROV. Small sand baggies are placed inside open spaces in the upper compartment for additional weight.
The thrusters are four 500 GPH Johnson Pump Cartridge Bilge Pump. Two are for vertical movement and two for horizontal movement. The two that are used for horizontal movement are placed on the back end and parallel to one another on top of the ROV ballasts so it can be moved similarly to that of a tank. The vertical thrusters are centered in the middle of the ROV. The thrusters are held in place on the PVC pipe using hose clamps that are epoxy and hot glued together. The propellers for propulsion come from model airplanes. The sizes for the horizontal (larger) and vertical (smaller) thrusters are different in order to fit the ROV design while still allowing for enough thrust for movement. The wiring for the controller, control relays, and lighting is designed to have minimal numbers of wires running between the controller and the ROV. The set-up for the camera system uses video baluns, a 75-foot Ethernet cable, portable DVD player, and a mini-security camera. The control, power wires (both slightly longer then 50 feet), and Ethernet cable are threaded though a 50 foot tether sleeve with Styrofoam floats zip-tied to it to allow for positive buoyancy. Their own 12-volt battery powers the camera system and ROV. The plankton net is based on an educational design set, but modified to fit this ROV.
Using these materials will assist in gathering data of plankton and fish abundance at two locations in the estuary. The first location is right behind the aquarium, roughly 1.5 miles upstream (site A). The second location is in Flanders Bay and in the vicinity of Hubbard County Park (site B). Site B a common spot where the tour boat goes to perform seine net catches and gather specimens on a remote beach. At both sites, surface and bottom water quality readings (temperature, oxygen, and salinity) will be taken using the YSI meter. At site A, the ROV’s camera system will be use to determine the abundance of fish by counting the number of fish viewed on a portable DVD player located on the surface. The plankton net will will assist in determining the plankton abundance, with a magnifying glass to identify the species caught. At site B, the ROV will be used for the same purposes as at site A for determining plankton abundance, but a seine net will be used to determine the abundance of fish. The reasons for the different fish abundance methods is because site A’s depth is too great to perform a seine net catch, and a seine net should be more accurate then using a TV screen and camera.
Once the daily abundance and water quality data has been collected, diversity indices will be used to determine the diversity of the population and any correlation between the quantified diversity values and the graphed water quality readings. The diversity indices that will be used include the Shannon Weiner index, Simpson’s Diversity index, and Morisita’s index. The Shannon Wiener index uses richness and evenness to indicate the species diversity of an area. The higher the calculated values indicate a high diversity for that area. The higher value also an indicator of lower competition between species. The Simpson’s Diversity Index expresses the probability that two individuals drawn from the community at random will be from same species. The higher the calculated value, the lower the diversity of the area. The Morisita’s Index quantifies the degree of overlap between two arrays of species from two areas. Low calculated values means that there is no similarity between the two areas. High values indicate a strong similarity of diversity. The reason for using multiple indices is to have enough information to support the hypothesis of how water quality affects the diversity of species.
Additional data that will be collected includes the current moon phase of that day and if the tide is flooding or ebbing. Data will be collected on days when an internist or project leader will be on the boat using the equipment and during the season when the tour boat is active (May-September). The data collected by the internists will be sent to the project leader via email for review and organization. The data and indices equations will be put into a Microsoft Excel program and the combination of water quality graphs and indices table will help to determine to what extent water quality has on the diversity of species in the area.
Expected Results
What can be generally expected from the data collected is a greater diversity of marine species at Site B then at Site A because of the greater salinity. The Shannon Weiner index and Simpson’s Diversity index should also indicate that the diversity is greater at Site B. However, it can also be expected that because of the ever-changing tidal ranges, the diversity at Site A will fluctuate depending the gravitational force between the sun and moon. The calculated index value for Site A should not be greater then the diversity at Site B. The reason for recording the moon phases of that day and tidal movements is to have additional information to support the hypothesis. An example of a situation for when this could happen is during a Full moon when the tidal ranges are highest, leading towards the diversity values for both sites as nearly equal. The Morisita’s index will determine to what degree the diversity at both sites are similar or different and will support the values calculated by the other indices. If the Morista’s index values are high, it indicates a similarity between the two locations. The values for the Shannon Weiner and Simpson’s indices should also indicate a similar level of diversity.
References
Alpine A and Cloern J (1992). Trophic interactions and direct physical effects control phytoplankton biomass and production in an estuary. Limnol. Oceanogr. 37(5): 946-955.
Boehlert G and Mundy B (1988). Roles of Behavioral and Physical Factors in Larval and Juvenile Fish Recruitment to Estuarine Nursery Areas. American Fish Society Symposium 3: 51-67.
Cloern J, Alpine A, Cole B, Wong R, Arthur J, and Ball M (1983). River Discharge Controls Phytoplankton Dynamics in the Northern San Francisco Bay Estuary. Estuarine, Coastal and Shelf Science 16: 415-429.
Cloern J (1991). Tidal stirring and phytoplankton bloom dynamics in an estuary. Journal of Marine Research 49: 203-221.
Roman M, Zhang X, McGillard C, and Boicourt W (2005). Seasonal and annual variability in the spatial patterns of plankton biomass in Chesapeake Bay. Limnol. Oceanogr. 50(2): 480-492.

Looks like a great project! Good luck with it and keep up the good work. I trust the YSI meter is providing valuable data and, as always, if you need anything from us you can always contact environmental@ysi.com.